User defined axes
Example 20 - User labelling of axes
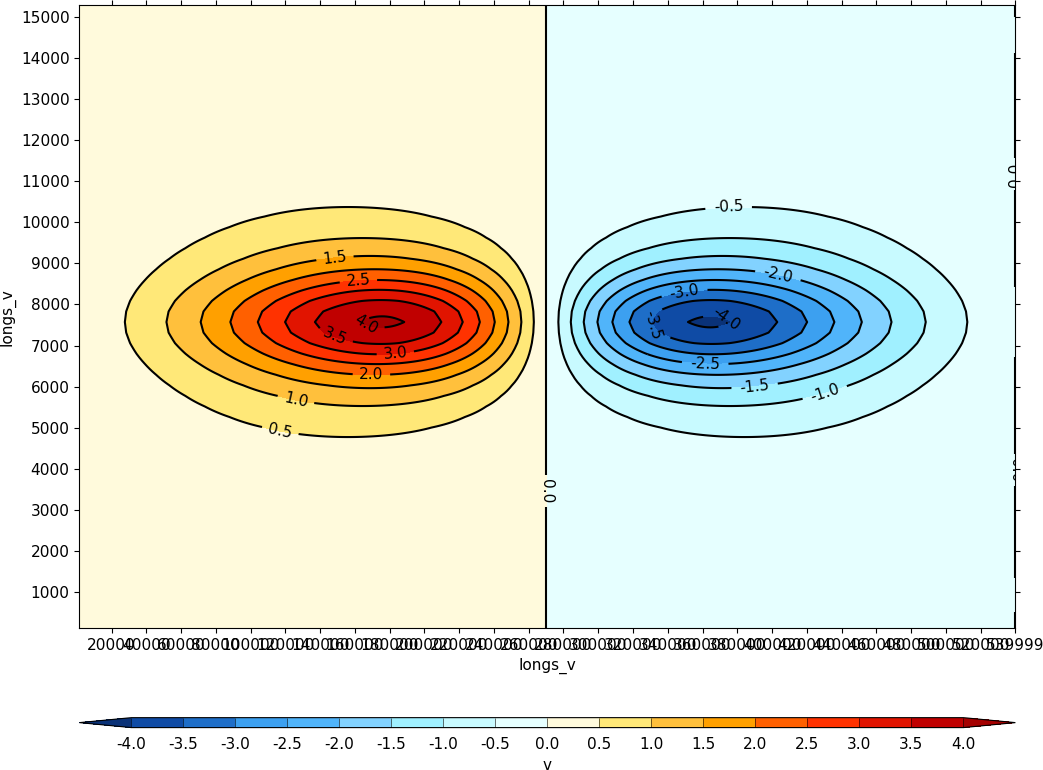
import cf
import cfplot as cfp
f=cf.read('cfplot_data/Geostropic_Adjustment.nc')[0]
cfp.con(f.subspace[9])
In the following plot the axes were labelled with the axes command before making a contour map of the data. The xticklabels and yticklabels options can be used to fine tune the axis labels.
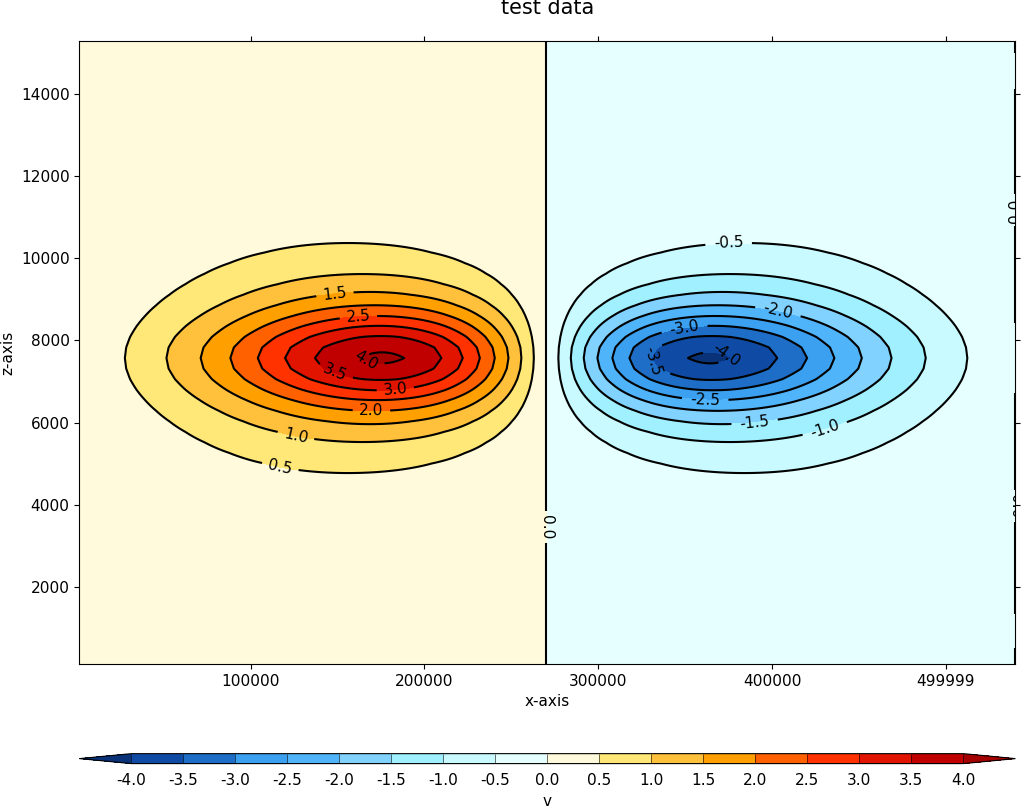
import cf
import cfplot as cfp
import numpy as np
f=cf.read('cfplot_data/Geostropic_Adjustment.nc')[0]
cfp.con(f.subspace[9], title='test data', xticks=np.arange(5)*100000+100000,
        yticks=np.arange(7)*2000+2000, xlabel='x-axis', ylabel='z-axis')