Latitude / longitude - pressure
Example 6 - latitude - pressure
import cf
import cfplot as cfp
f=cf.read('cfplot_data/ggap.nc')[2]
cfp.con(f.subspace(longitude=0))
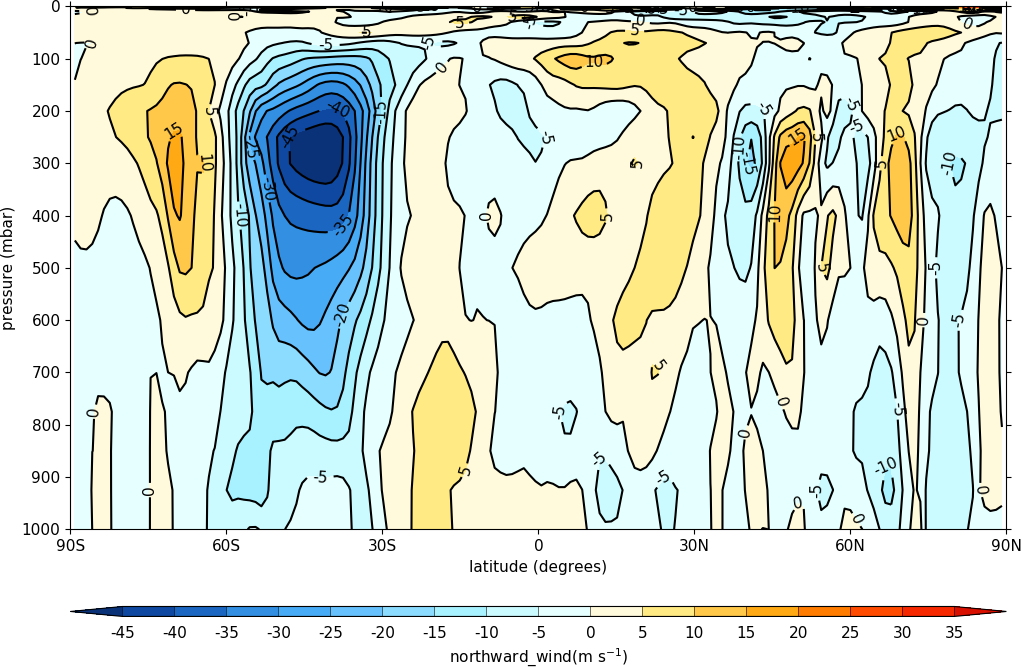
Example 7 - latitude - pressure - zonal mean
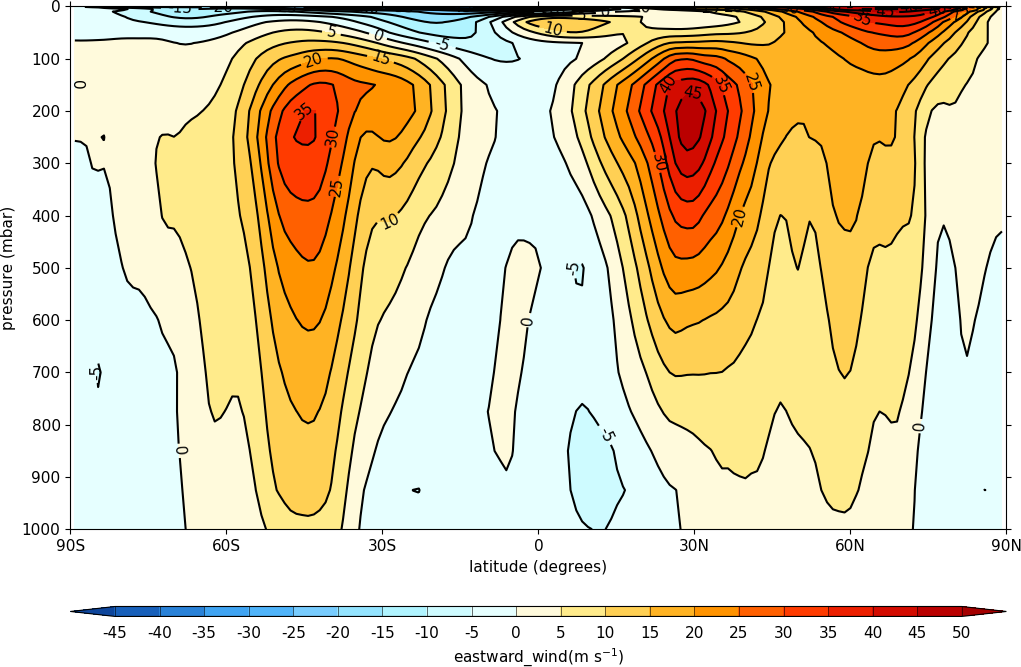
import cf
import cfplot as cfp
f=cf.read('cfplot_data/ggap.nc')[1]
cfp.con(f.collapse('mean','longitude'))
Example 8 - latitude - log pressure
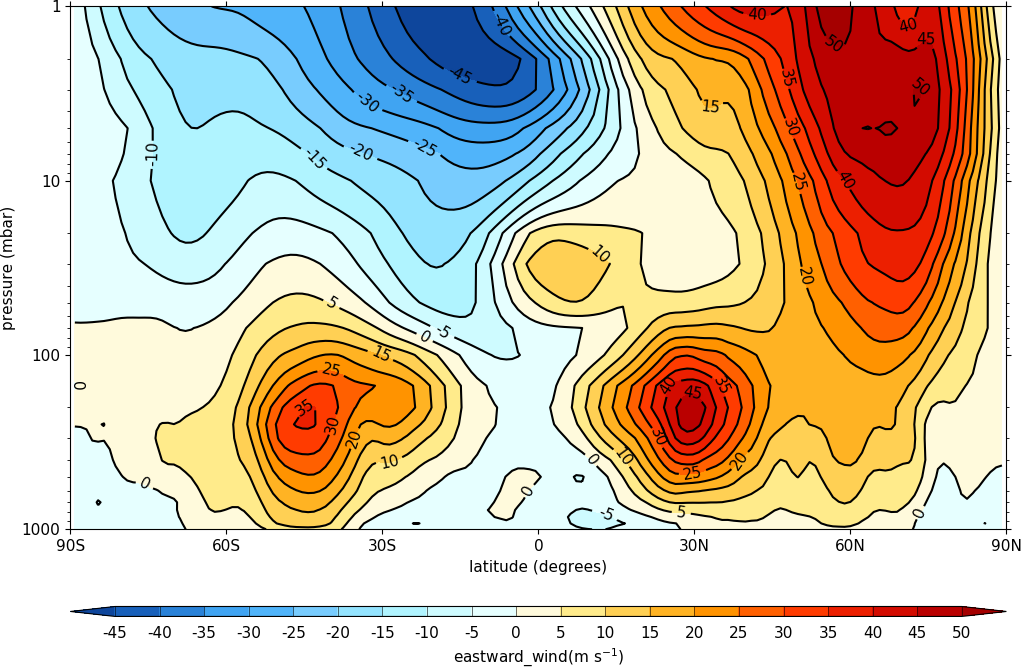
import cf
import cfplot as cfp
f=cf.read('cfplot_data/ggap.nc')[1]
cfp.con(f.collapse('mean','longitude'), ylog=True)
Example 9 - longitude - pressure
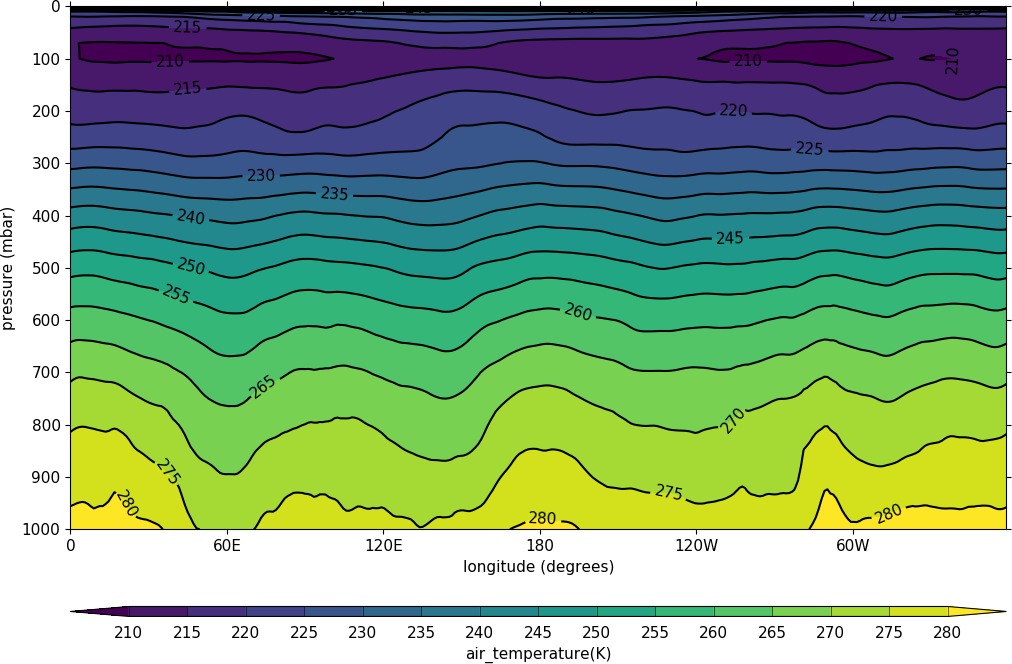
import cf
import cfplot as cfp
f=cf.read('cfplot_data/ggap.nc')[0]
cfp.con(f.collapse('mean', 'latitude'))