Hovmuller plots
Example 10 - latitude-time
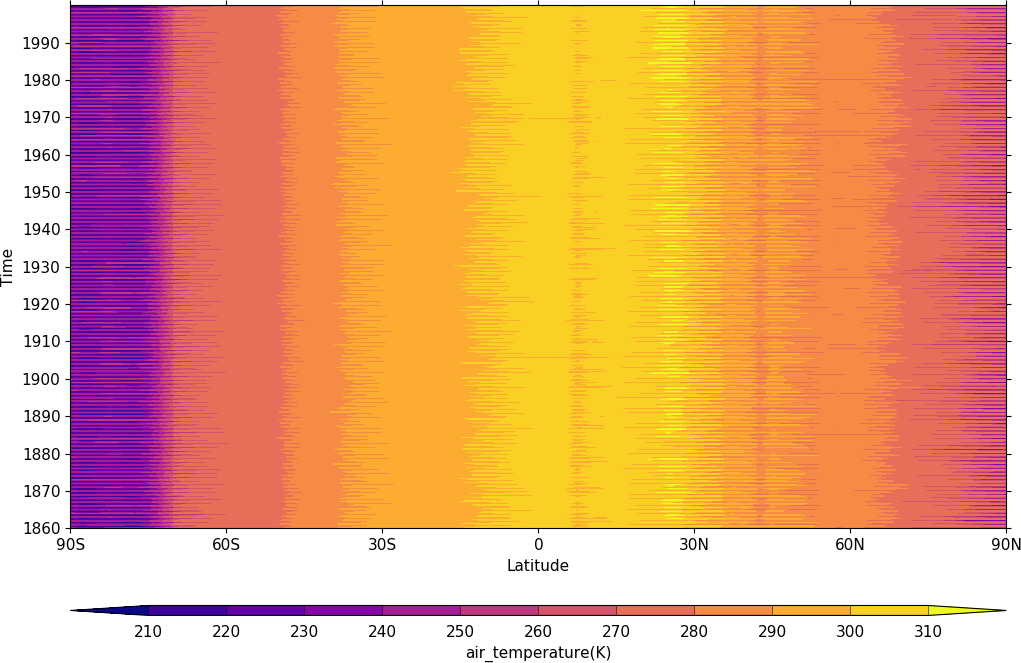
import cf
import cfplot as cfp
f=cf.read('cfplot_data/tas_A1.nc')[0]
cfp.cscale('plasma')
cfp.con(f.subspace(longitude=0), lines=False)
Example 11 - latitude-time subset
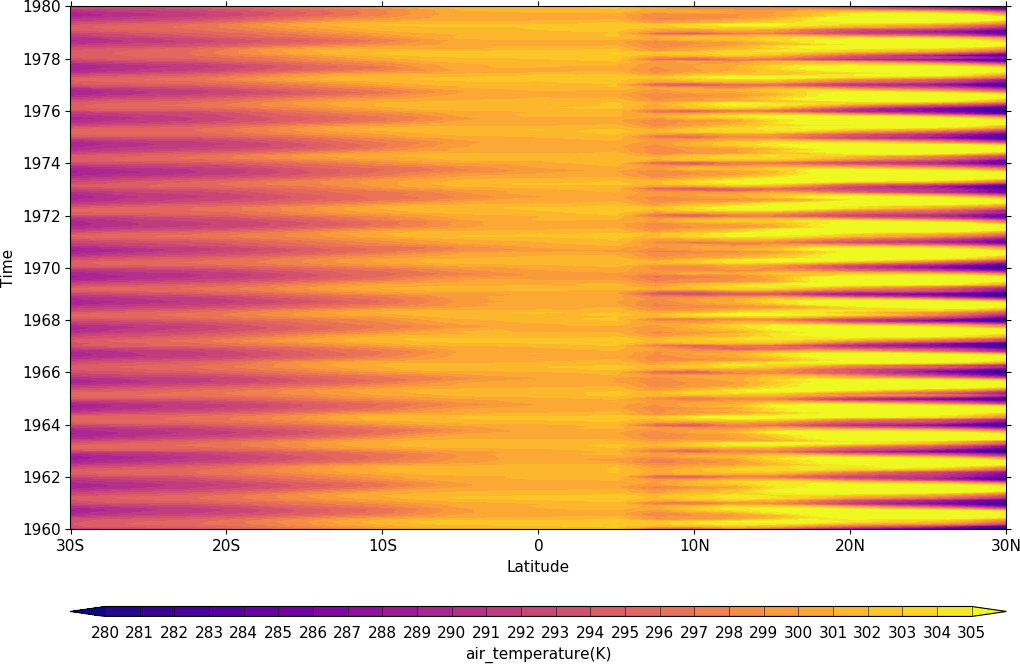
import cf
import cfplot as cfp
f=cf.read('cfplot_data/tas_A1.nc')[0]
cfp.gset(-30, 30, '1960-1-1', '1980-1-1')
cfp.levs(min=280, max=305, step=1)
cfp.cscale('plasma')
cfp.con(f.subspace(longitude=0), lines=False)
When using cfp.gset the correct date format is 'YYYY-MM-DD' or 'YYYY-MM-DD HH:MM:SS' - anything else will give unexpected results.
Example 12 - longitude-time plot
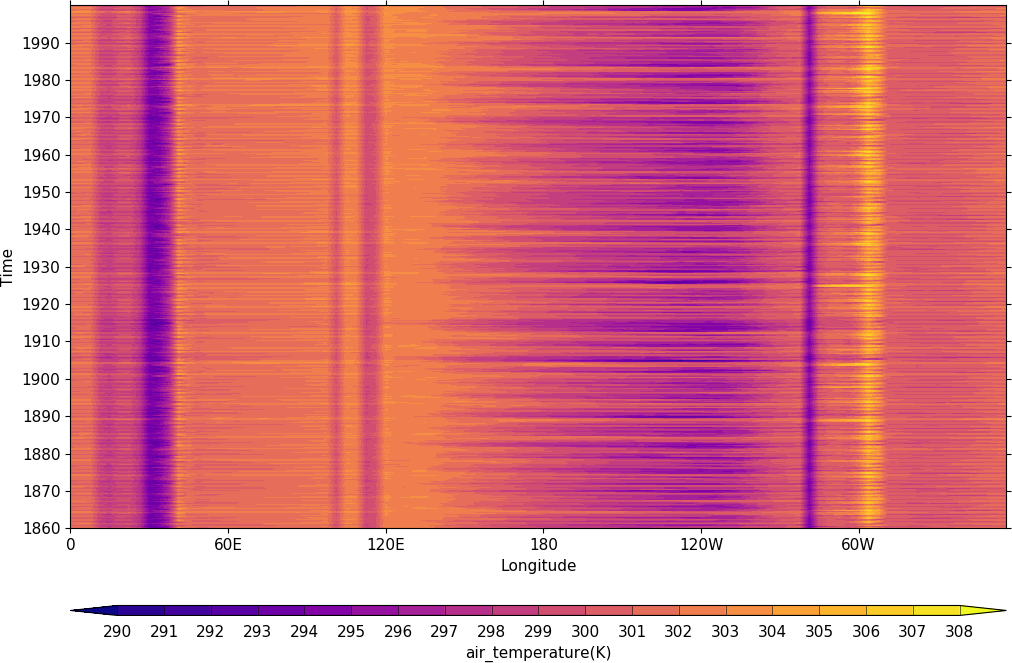
import cf
import cfplot as cfp
f=cf.read('cfplot_data/tas_A1.nc')[0]
cfp.cscale('plasma')
cfp.con(f.subspace(latitude=0), lines=F
alse)