Cylindrical projection
Example 1 - basic cylindrical projection
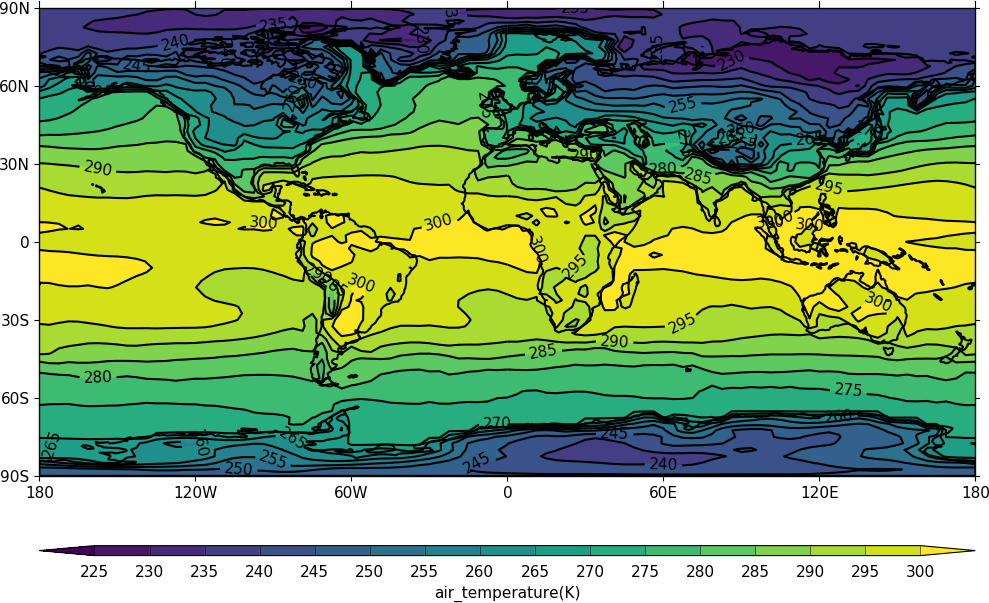
import cf
import cfplot as cfp
f=cf.read('cfplot_data/tas_A1.nc')[0]
cfp.con(f.subspace(time=15))
Example 2 - cylindrical projection with blockfill
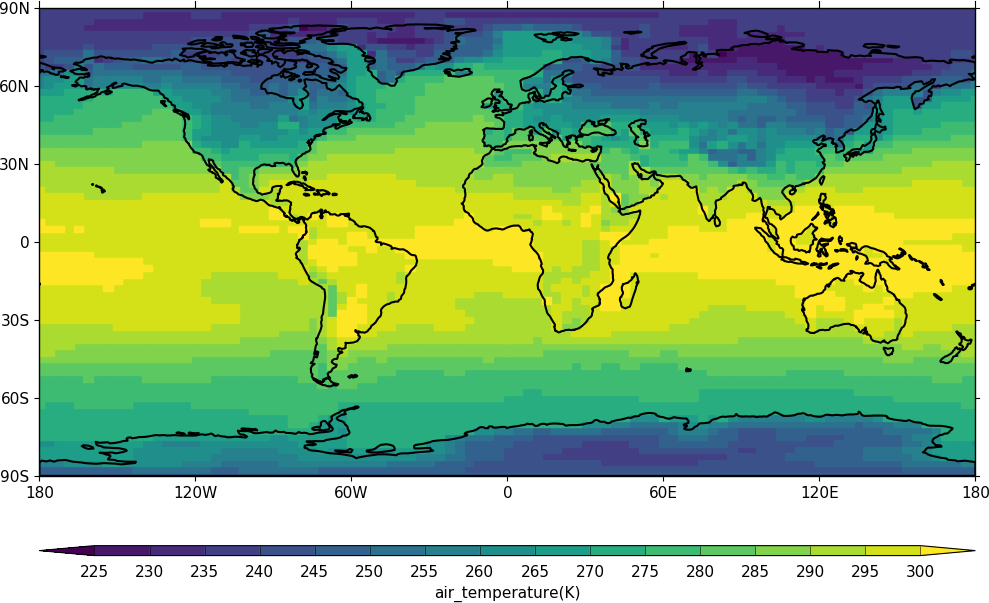
import cf
import cfplot as cfp
f=cf.read('cfplot_data/tas_A1.nc')[0]
cfp.con(f.subspace(time=15), blockfill=True, lines=False)
Example 3 - altering the map limits and contour levels
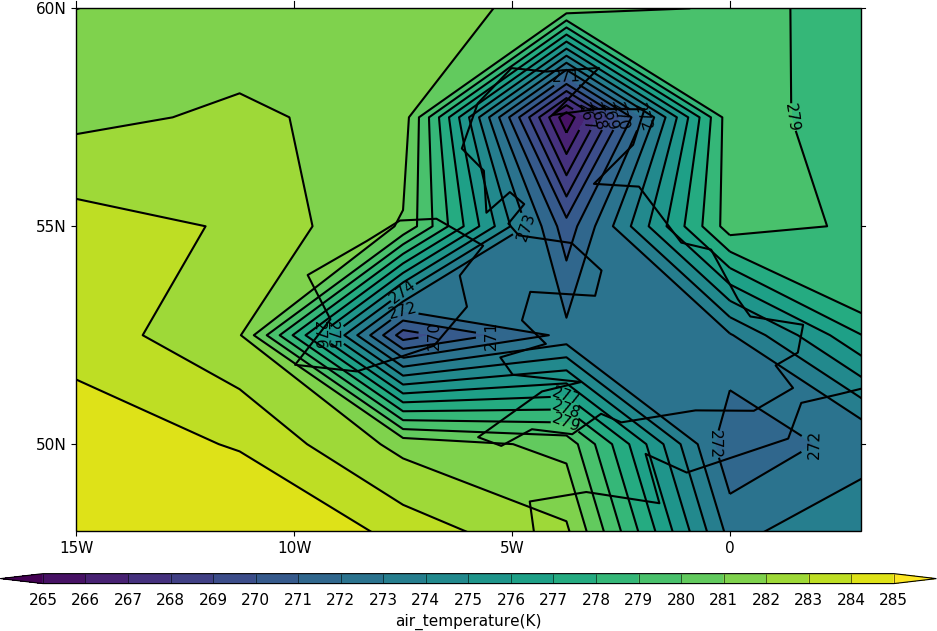
import cf
import cfplot as cfp
f=cf.read('cfplot_data/tas_A1.nc')[0]
cfp.mapset(lonmin=-15, lonmax=3, latmin=48, latmax=60)
cfp.levs(min=265, max=285, step=1)
cfp.con(f.subspace(time=15))