cf-plot homepage
Warning - these pages are static and will be removed at some stage in the future. The new location will be https://ncas-cms.github.io/cf-plot
cf-plot is a set of Python routines for making the common contour, vector and line plots that climate researchers use. The data to make a contour plot can be passed to cf-plot using cf-python as in the following example.
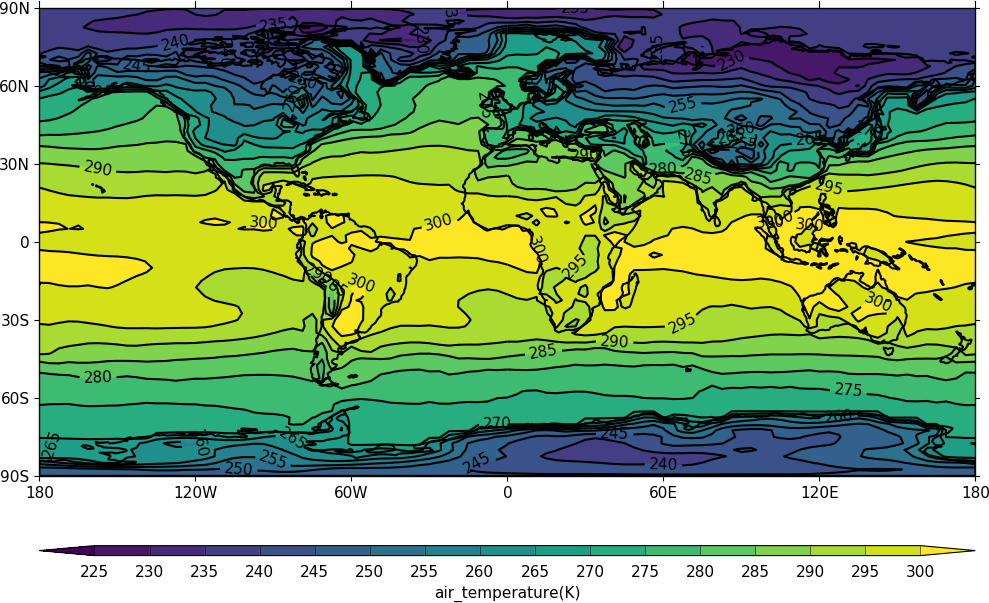
import cf
import cfplot as cfp
f=cf.read('cfplot_data/tas_A1.nc')[0]
cfp.con(f.subspace(time=15))